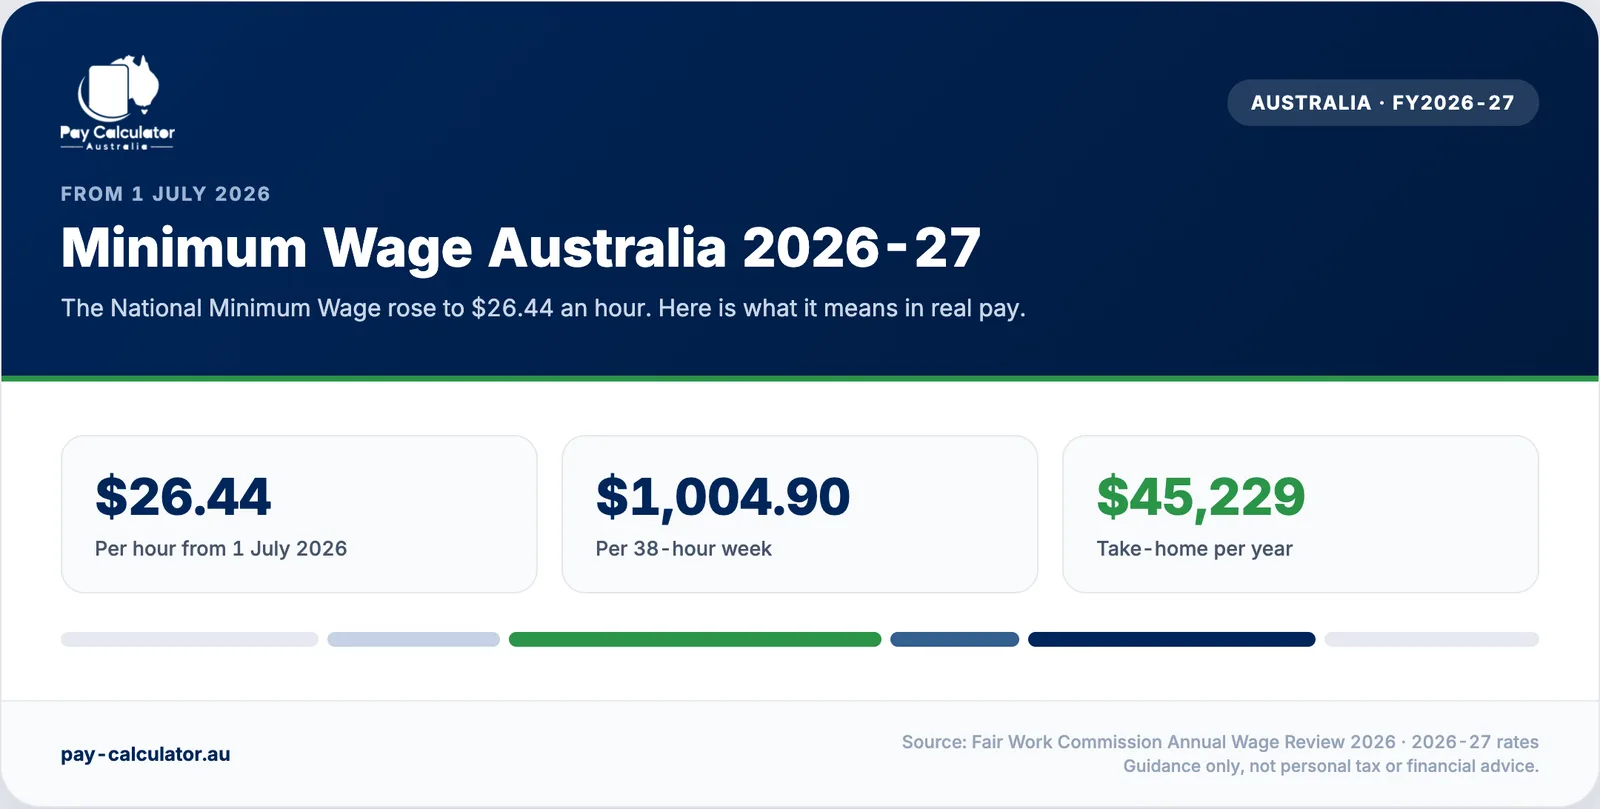
The Fair Work Commission has raised the National Minimum Wage every year since 2010, from $569.90 a week ($15.00 an hour) to $1,004.90 a week ($26.44 an hour) from 1 July 2026, a cumulative rise of 76.3% over sixteen years. This guide lists all seventeen of those decisions: the effective date, the weekly and hourly rate, the dollar rise, the percentage rise, and how each year measured up against inflation. For the rate that applies to your pay today, see the current minimum wage guide; this page is the history behind it.
Key takeaways
- The NMW rose from $569.90 to $1,004.90 a week between 2010 and 2026, up 76.3% (Fair Work Commission).
- The single biggest rise in the series was 2023: $70.20 a week, about 8.6%, bigger than 2026's 6.0%.
- 2022 was a real-terms cut on the NMW (5.2% against ~6.7% inflation). 2023 looked like one too, but only on award wages (5.75%); the NMW's own 8.6% rise that year was a real gain.
- Fair Work sometimes publishes two percentages for the same year, the NMW's own rise and a separate, lower award-wage rise; 2023 and 2026 are the clearest examples.
- For the 2026-27 rate, who it applies to and what it pays after tax, see the current minimum wage guide linked above.
The National Minimum Wage, every year from 2010 to 2026
All weekly rates are the sourced figures from Fair Work Commission National Minimum Wage Orders and Annual Wage Review decisions, cited by decision reference in the table. Hourly rates are the weekly rate divided by 38, the standard full-time week. The dollar and percentage increase columns are calculated here from the weekly column: this year's rate minus last year's, divided by last year's.
| Effective from | Weekly rate | Hourly rate | $ increase | % increase | Notes |
|---|---|---|---|---|---|
| 1 Jul 2010 | $569.90 | $15.00 | Series start | n/a | First Fair Work Commission rate. The pre-2010 era is a different system, see below. |
| 1 Jul 2011 | $589.30 | $15.51 | $19.40 | 3.40% | |
| 1 Jul 2012 | $606.40 | $15.96 | $17.10 | 2.90% | |
| 1 Jul 2013 | $622.20 | $16.37 | $15.80 | 2.61% | |
| 1 Jul 2014 | $640.90 | $16.87 | $18.70 | 3.01% | |
| 1 Jul 2015 | $656.90 | $17.29 | $16.00 | 2.50% | |
| 1 Jul 2016 | $672.70 | $17.70 | $15.80 | 2.41% | The smallest rise up to that point, in a low-inflation period. |
| 1 Jul 2017 | $694.90 | $18.29 | $22.20 | 3.30% | |
| 1 Jul 2018 | $719.20 | $18.93 | $24.30 | 3.50% | |
| 1 Jul 2019 | $740.80 | $19.49 | $21.60 | 3.00% | |
| 1 Jul 2020 | $753.80 | $19.84 | $13.00 | 1.75% | Smallest rise in this series, held down by the COVID-19 downturn. |
| 1 Jul 2021 | $772.60 | $20.33 | $18.80 | 2.49% | |
| 1 Jul 2022 | $812.60 | $21.38 | $40.00 | 5.18% | Inflation outran this rise, a real-terms cut. See the inflation section below. |
| 1 Jul 2023 | $882.80 | $23.23 | $70.20 | 8.64% | The largest rise in this series, in both dollars and per cent. Fair Work headlined a 5.75% rise to award wages that year; the NMW itself rose by more. |
| 1 Jul 2024 | $915.90 | $24.10 | $33.10 | 3.75% | |
| 1 Jul 2025 | $948.00 | $24.95 | $32.10 | 3.50% | |
| 1 Jul 2026 | $1,004.90 | $26.44 | $56.90 | 6.00% | Includes a one-off structural adjustment as the C13 award classification is phased out. Award wages alone rose 4.75%. |
Decision references: Fair Work Commission National Minimum Wage Orders and Annual Wage Review decisions, 2010-2026. That calculation matches the Commission's own headline percentage for every year except 2023 and 2026, when Fair Work quoted a separate, lower percentage for modern award wages generally (5.75% and 4.75%) rather than the NMW's own rise. For 2020, 2021 and 2022 specifically, the percentage shown here was calculated from the published dollar rates rather than quoted verbatim in Fair Work's own summary of that year's decision; treat those three as computed, not directly quoted Commission figures.
How much has the minimum wage gone up since 2010?
The National Minimum Wage has climbed $435.00 a week since 2010, from $569.90 to $1,004.90, a cumulative rise of 76.3%. On the hourly figure that is $15.00 to $26.44, up $11.45 an hour over the same sixteen years. In 2015 it sat roughly in the middle of that climb at $656.90 a week ($17.29 an hour); by 2020 it had reached $753.80 a week ($19.84 an hour).
The single largest rise in dollar and percentage terms was 2023, not 2026. The rate went from $812.60 to $882.80, a rise of $70.20 a week or about 8.6%, computed directly from those two published rates. Fair Work's own headline that year was a 5.75% rise to modern award wages generally, which is the figure most reporting used, but the National Minimum Wage itself moved by more. The next-largest rises were 2026 (6.0%) and 2022 (5.2%).
Has the minimum wage kept up with inflation?
Over the full 2010-2026 period, yes: the minimum wage's 76.3% cumulative rise has outpaced the Australian Consumer Price Index, which has risen roughly 42-45% over the same span (a rough estimate; a precise comparison needs quarter-by-quarter ABS data). Year by year is a different story. The table below compares each year's Annual Wage Review percentage against CPI for 2020 to 2026; every CPI figure here is an indicative estimate, not a precise ABS quarterly figure, so treat the real gain or loss as directional rather than exact.
| Year | NMW rise | CPI (annual, indicative) | Real gain / (loss) | What happened |
|---|---|---|---|---|
| 2020 | 1.8% | ~0.7% | +1.1% | Pandemic caution; the rise still beat a near-flat CPI. |
| 2021 | 2.5% | ~2.0% | +0.5% | A thin real gain as the recovery began. |
| 2022 | 5.2% | ~6.7% | (1.5%) | The inflation surge outran the rise: a real cut. |
| 2023 | 8.6% | ~6.0% | +2.6% | A real gain on the NMW itself. Award wages, the figure most reporting used, rose separately by 5.75% that year, only roughly flat against CPI. |
| 2024 | 3.75% | ~3.5% | +0.25% | Inflation moderating; a small real gain returns. |
| 2025 | 3.5% | ~2.7% | +0.8% | A firmer real gain as inflation falls further. |
| 2026 | 6.0% | ~2.2% | +3.8% | Includes the one-off C13 structural adjustment. Award wages rose separately by 4.75% that year, about +2.55% real. |
This table always uses the National Minimum Wage's own percentage rise, the same series as the main table above. In most years that also equals the modern award wage rise Fair Work headlines, but 2023 and 2026 are exceptions: the award figure was lower (5.75% and 4.75%), and is called out separately in the notes column rather than substituted for the NMW figure. Source: Australian Bureau of Statistics, Consumer Price Index, Australia (selected quarters); Fair Work Commission Annual Wage Review decisions.
Only one year in this run was a genuine real-terms cut on the National Minimum Wage itself: 2022, when 5.2% ran into roughly 6.7% inflation, a real loss of about 1.5%. 2023 is commonly misremembered as a second cut, because Fair Work's headline that year was a 5.75% rise to modern award wages, which was only roughly flat against that era's roughly 6.0% inflation. But the National Minimum Wage itself rose by more, about 8.6%, a real gain of roughly 2.6% once CPI is subtracted. Most reporting at the time used the award figure, so award-covered workers experienced something close to a wash in 2023 while the NMW itself pulled ahead. 2024 and 2025 restored a modest real gain as inflation cooled, and 2026's real gain is boosted further by the one-off C13 structural adjustment on top of the ordinary rise.
Why has the Commission's reasoning shifted over time?
Each year, an Expert Panel of the Fair Work Commission reviews the minimum wage under s.285 of the Fair Work Act 2009, weighing a recurring set of factors: cost of living, inflation and CPI, business conditions and competitiveness, and (from 2026) award structure. Which factor dominates moves with the economic cycle, not a fixed formula.
- Inflation and CPI has been the primary benchmark in most years of the series.
- Cost of living for low-paid workers has carried explicit, named weight since 2020.
- Business conditions and competitiveness were most prominent through the volatile 2020-2022 stretch, when the pandemic and its aftermath dominated submissions.
- Award structure entered the picture in 2026, when the Commission began phasing out the C13 classification, a one-off adjustment layered on top of the general rise.
Decisions are typically announced in early June, with the new rates taking effect from the first full pay period on or after 1 July, which is why the same headline number can land on a payslip a few days apart depending on your employer's pay cycle.
What was the minimum wage before 2010?
A different, non-comparable system. From 2000 to 2005 the Australian Industrial Relations Commission set the federal minimum, largely through the Metal, Engineering and Associated Industries Award 1998 and related instruments. From 2006 to 2010, under the Work Choices changes, the Australian Fair Pay Commission took over. The Fair Work Commission then took over from 2010, under the Fair Work Act 2009, and $569.90 a week ($15.00 an hour) was its first published rate.
The calculation methods, coverage rules and even the name of the minimum changed across those three regimes, so the pre-2010 AIRC and AFPC figures are not spliced into the table above. If you need that earlier era, the Fair Work Commission's own History of the Australian Minimum Wage (prepared by the Hon. Reg Hamilton) is the authoritative source, and it treats the 2010 changeover as the same methodological break this page does.
What is the minimum wage right now?
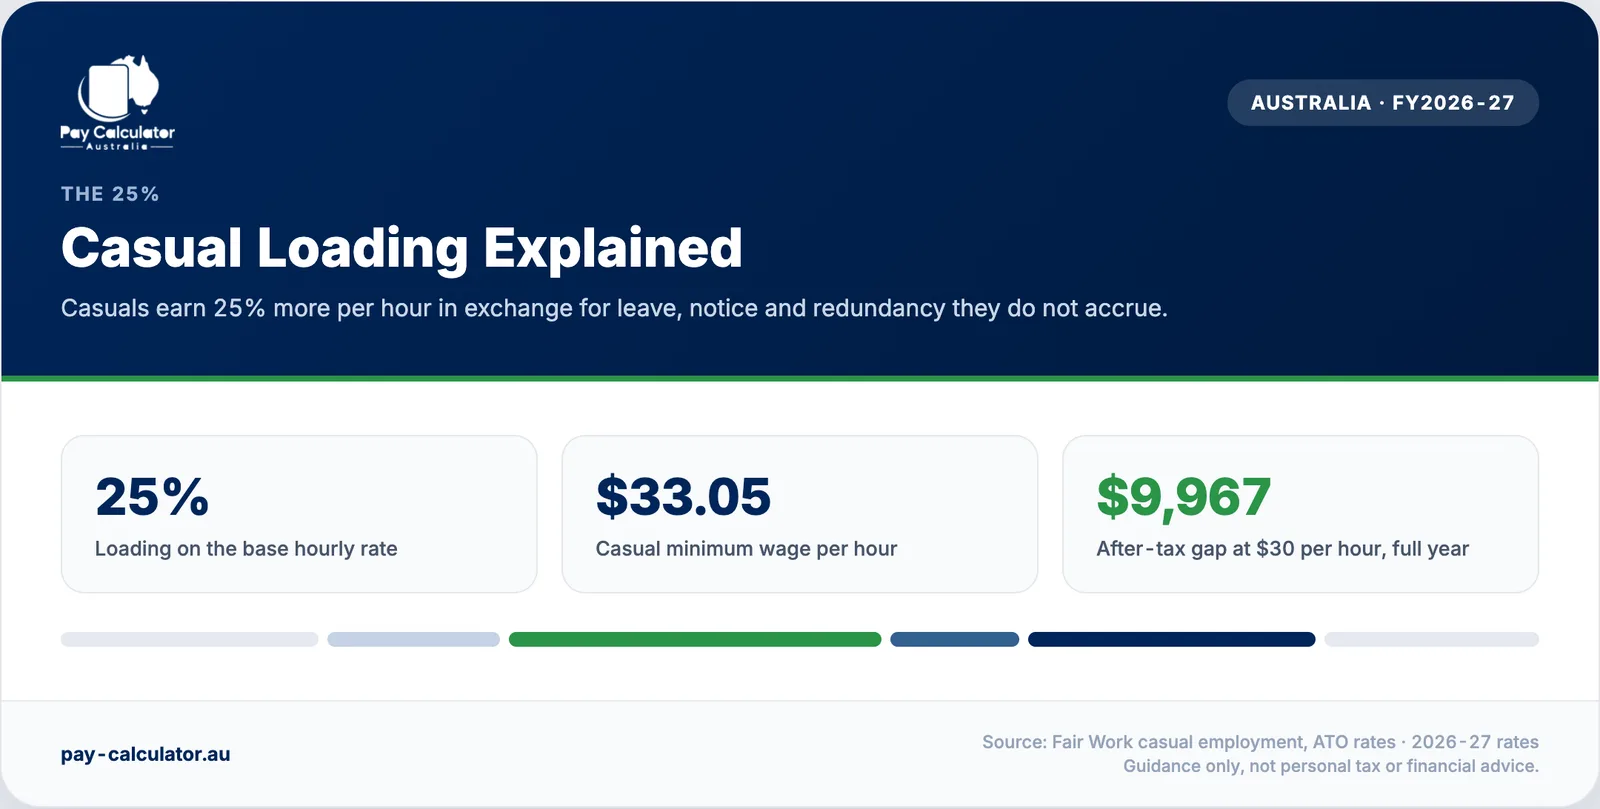
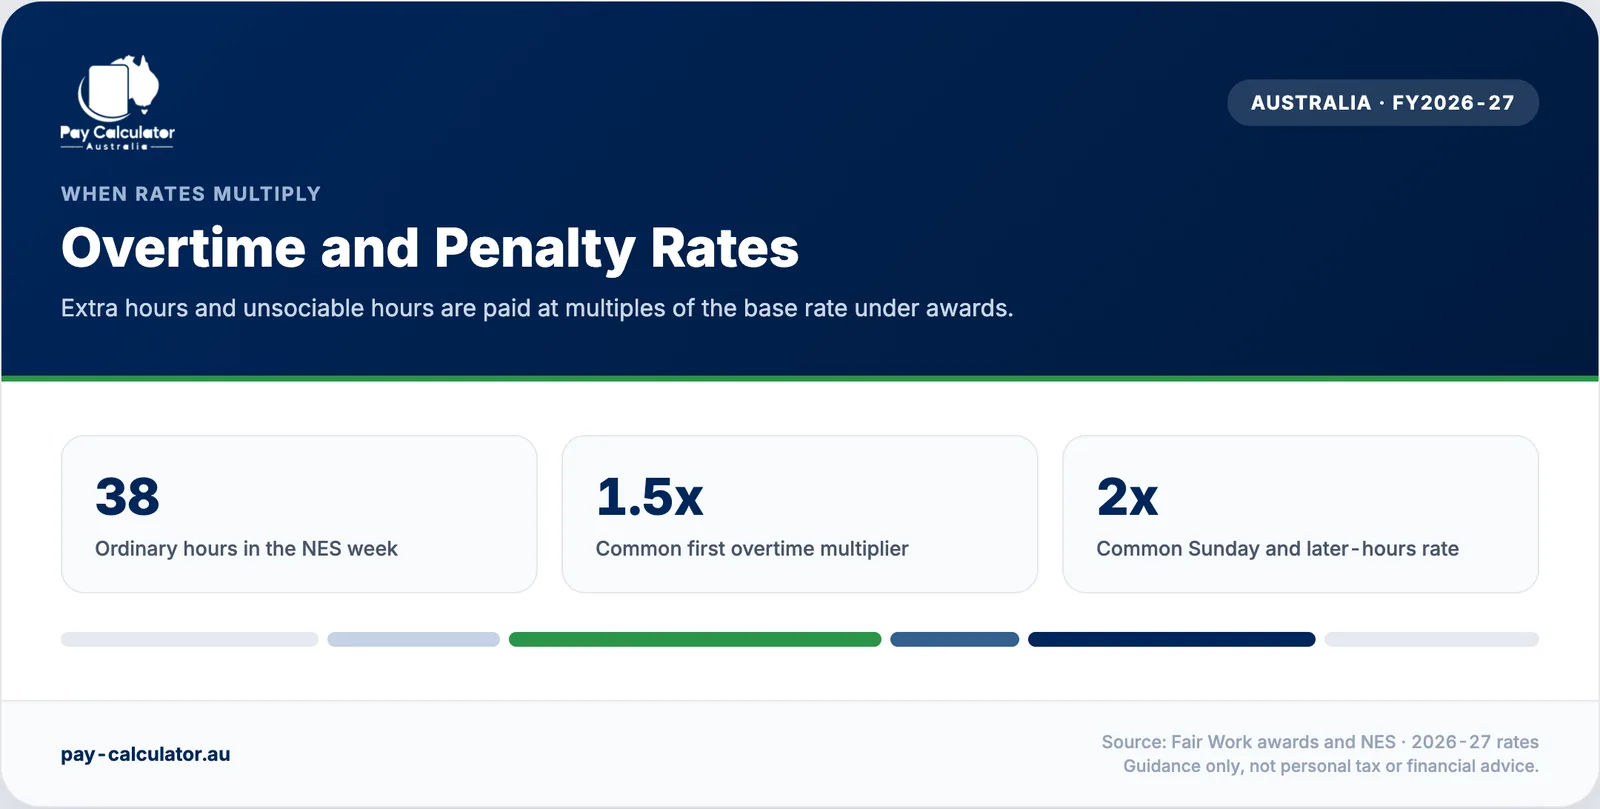
$1,004.90 a week, or $26.44 an hour, from the first full pay period on or after 1 July 2026, set by the Annual Wage Review 2026 decision ([2026] FWCFB 3500). That is the end point of the series above, not a separate figure. For who the NMW actually covers, the 25% casual loading, award rates that sit above it, and what a year on it leaves after tax, the minimum wage Australia guide covers all of it in depth. Related reading: casual loading explained and overtime and penalty rates.
Minimum wage history FAQ
Sources
- Fair Work Commission, Annual Wage Reviews (archive), all years 2010-2026.
- Fair Work Commission, National Minimum Wage Orders, years 2010-2026.
- Fair Work Commission, Decision [2010] FWAFB 4000, the first Fair Work minimum wage decision, announced 20 May 2010.
- Fair Work Commission, Annual Wage Review 2023-24, Decision [2024] FWCFB 3500, announced 3 June 2024.
- Fair Work Commission, Annual Wage Review 2025, Decision [2025] FWCFB 3500, announced 3 June 2025.
- Fair Work Commission, Annual Wage Review 2026, Decision [2026] FWCFB 3500, announced 2 June 2026.
- Fair Work Commission, History of the Australian Minimum Wage (prepared by the Hon. Reg Hamilton).
- Fair Work Ombudsman, Minimum wages, updated 1 July 2026.
- Fair Work Ombudsman, Annual Wage Review, updated 2026.
- Australian Bureau of Statistics, Consumer Price Index, Australia, various releases 2010-2026 (used for the indicative inflation comparison).
Last verified 27 July 2026. The dollar and percentage increase columns in the main table are arithmetic on the sourced weekly rates above; CPI figures are indicative estimates, not exact ABS quarterly data.