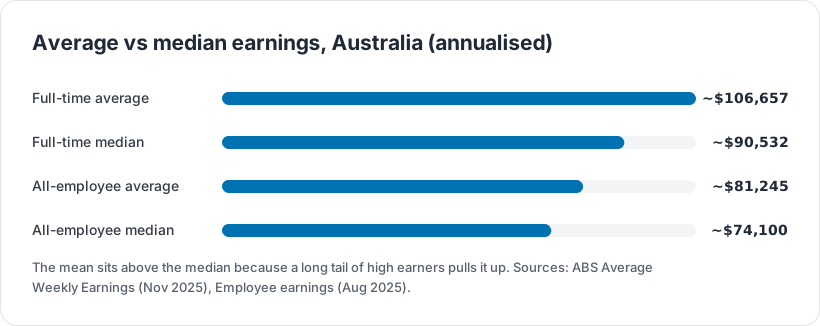
The average full-time salary in Australia is about $106,657 a year, based on the Australian Bureau of Statistics measure of full-time adult ordinary time earnings for November 2025. That headline average is useful, but it sits above what most workers actually earn, because a smaller number of very high salaries pull the average up. This page sets the average and the median side by side, breaks the figures down by sex and sector, and shows the take-home pay left after income tax and the Medicare levy for 2026-27.
Key takeaways
- The average full-time salary is about $106,657 a year, or $2,051.10 a week (ABS, seasonally adjusted, November 2025).
- The median full-time worker earns less, about $90,532 a year ($1,741 a week), because high earners lift the average above the middle (ABS, August 2025).
- Across all employees, not just full-time, average total pay is $1,562.40 a week (about $81,245 a year) and the median is $1,425 a week (about $74,100 a year).
- On the ABS full-time measure, men out-earn women in both the public and private sectors.
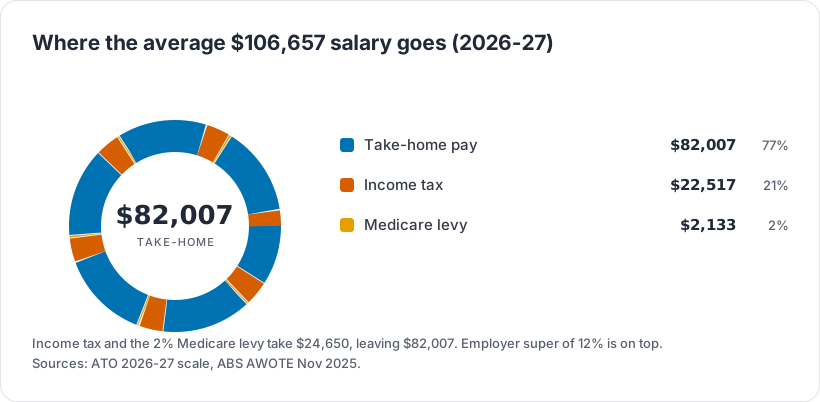
- On the average salary of $106,657, an Australian resident keeps about $82,007 after $22,517 income tax and $2,133 Medicare levy, with 12% super paid on top (2026-27).
What is the average salary in Australia?
The most cited average salary figure is the ABS full-time adult average weekly ordinary time earnings, known as AWOTE. In November 2025 it was $2,051.10 a week seasonally adjusted, which annualises to about $106,657 a year. Two related ABS averages sit alongside it: full-time adult average weekly total earnings, which adds overtime and comes to $2,125.80 a week (about $110,542 a year), and average weekly total earnings across all employees, which includes part-time and casual workers and is lower at $1,562.40 a week (about $81,245 a year).
| Measure (November 2025) | Per week | Per year (annualised) |
|---|---|---|
| Full-time adult AWOTE (ordinary time) | $2,051.10 | ~$106,657 |
| Full-time adult total earnings (incl. overtime) | $2,125.80 | ~$110,542 |
| All employees total earnings | $1,562.40 | ~$81,245 |
Seasonally adjusted. Annualised figures multiply the weekly figure by 52. All figures are gross, before tax, and exclude employer superannuation. Source: ABS, Average Weekly Earnings, Australia, November 2025 (catalogue 6302.0).
Average versus median: what a typical worker earns
An average can mislead. The ABS average is a mean, so a relatively small group of very high earners drags it upward and leaves it above the pay of the person in the middle. The median, the point where half of workers earn more and half earn less, is the better guide to a typical wage. For full-time employees the median was $1,741 a week in August 2025, about $90,532 a year, roughly $16,000 below the full-time average. Across all employees the median was $1,425 a week, about $74,100 a year.
| Median earnings (August 2025, main job) | Per week | Per year (annualised) |
|---|---|---|
| Full-time employees (persons) | $1,741 | ~$90,532 |
| All employees | $1,425 | ~$74,100 |
| Full-time males | $1,841 | ~$95,732 |
| Full-time females | $1,631 | ~$84,812 |
Source: ABS, Employee earnings, August 2025 (catalogue 6337.0), main job, before tax.
How pay is spread across workers
The gap between the mean and the median comes from the shape of the distribution. The ABS earnings distribution for all employees in August 2025 shows how far apart the bottom and the top sit. A quarter of employees earned $900 a week or less, while the top tenth earned $3,000 a week or more. Because the highest earners have no ceiling, they lift the average well above the $1,425 median.
| Point in the distribution (all employees, August 2025) | Weekly earnings |
|---|---|
| 25th percentile | $900 |
| Median (50th percentile) | $1,425 |
| 75th percentile | $2,127 |
| 90th percentile | $3,000 |
Source: ABS, Employee earnings, August 2025 (catalogue 6337.0), all employees, main job.
Average pay by sex and sector
The ABS also splits full-time adult ordinary time earnings by sex and by sector. On this measure men earn more than women in both the public and private sectors, and public-sector pay runs ahead of private-sector pay for both. The figures below are weekly, for November 2025.
| Full-time adult AWOTE (November 2025) | Public sector (per week) | Private sector (per week) |
|---|---|---|
| Males | $2,347.50 | $2,109.10 |
| Females | $2,101.60 | $1,813.30 |
The pattern holds on the median measure too. Full-time males had median earnings of $1,841 a week (about $95,732 a year) against $1,631 a week for full-time females (about $84,812 a year) in August 2025.
Source: ABS, Average Weekly Earnings, Australia, November 2025 (catalogue 6302.0), seasonally adjusted.
The minimum wage floor
For context, the pay figures above sit well above the wage floor. From 1 July 2026 the National Minimum Wage is $1,004.90 a week, or $26.44 an hour, which is about $52,255 a year for a full-time worker. It applies to employees who are not covered by an award or registered agreement, and all modern award minimum wages rose by 4.75% from the first full pay period on or after 1 July 2026. The clearest way to read these numbers is as a ladder: the minimum wage is the floor, the median is the typical wage, and the average sits higher again because of top earners.
Take-home pay on the average salary
Gross salary is not what lands in your account. The table below runs the average full-time salary and the median full-time salary through the 2026-27 resident tax scale, the Low Income Tax Offset and the 2% Medicare levy, using the same engine as the calculators on this site. Employer superannuation of 12% is paid on top of these salaries, so it is not part of take-home pay.
| Basis | Gross salary | Income tax | Medicare levy | Take-home pay | Average tax rate |
|---|---|---|---|---|---|
| Average full-time (AWOTE) | $106,657 | $22,517 | $2,133 | $82,007 | 23.1% |
| Median full-time | $90,532 | $17,680 | $1,811 | $71,042 | 21.5% |
Computed on the 2026-27 ATO resident scale with the Low Income Tax Offset and the 2% Medicare levy. Gross salary excludes employer super, which is paid on top at 12%.
On the average full-time salary of about $106,657, an Australian resident pays $22,517 in income tax and $2,133 in Medicare levy, leaving about $82,007 a year, an average tax rate of 23.1%. The median full-time earner on about $90,532 keeps roughly $71,042. To run your own figure, use the income tax calculator or the take-home pay calculator.
Frequently asked questions
Sources
All figures verified against the named documents. Last verified 24 July 2026.
- ABS, Average Weekly Earnings, Australia, November 2025 (catalogue 6302.0), released 26 February 2026: full-time adult AWOTE $2,051.10/week, full-time adult total earnings $2,125.80/week, all employees total earnings $1,562.40/week, and the by-sex and by-sector figures.
- ABS, Employee earnings, August 2025 (catalogue 6337.0), released 12 December 2025: median weekly earnings for full-time ($1,741), all employees ($1,425), full-time males ($1,841) and females ($1,631), and the earnings distribution percentiles.
- Fair Work Ombudsman, Minimum wages increase from 1 July 2026 (Annual Wage Review 2026, 4.75%): National Minimum Wage $1,004.90/week ($26.44/hour).
- Australian Taxation Office, Tax rates: Australian residents (2026-27), the Low Income Tax Offset, and the Medicare levy: used to compute the take-home pay figures.